Purpose
The countercyclical capital buffer is an instrument to strengthen the resilience of the credit institutions by increasing their capitalisation requirements when risks in the financial system build up. The purpose of the buffer is to prevent a negative impact on the real economy when the financial system is stressed. In such situation the buffer must be released. Hence, the institutions may use the re-leased capital to e.g. absorb losses, thereby facilitating the scope for the institutions to maintain suitable credit extension in periods of stress in the financial system.
1. General approach to assessing the buffer rate
Systemic risks build up as a result of interaction between the financial system and the real economy. Systemic risks typically build up when optimism, low risk perception, rising asset prices and lenient credit conditions become self-reinforcing. That was the case, for example, during the years leading up to the financial crisis. When risks materialise, the mechanism reverses and the downturn is aggravated.
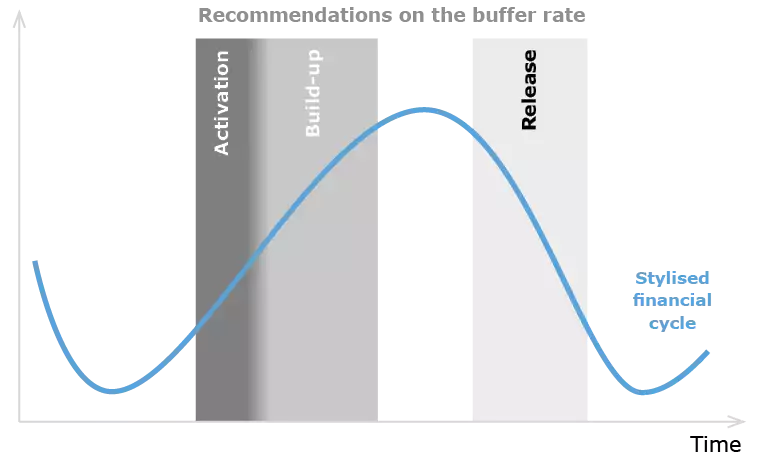
The Council will regularly recommend that the countercyclical capital buffer should be built up and released in step with the development in financial systemic risks. The relationship between the Council's approach to assessing the buffer rate and the development in systemic risks can be illustrated based on a stylised financial cycle, cf. Chart 1.[1] Systemic risks build up at the expansive stage of the financial cycle. Ideally, build-up of the buffer starts before financial imbalances emerge (Activation in Chart 1). As risks increase and imbalances become more apparent, the buffer rate is gradually raised (Build-up in Chart 1). The aim is for the buffer to be built up before the cycle reverses to ensure that the institutions are more resilient when risks materialise, for example, when the financial system is exposed to negative shocks. In that situation the buffer should be released.
However, identifying and measuring systemic risks is complex, so in practice the Council applies a broad information basis to assess the position of the economy in the financial cycle. The information basis includes indicators signalling the development of systemic risks in different phases of the financial cycle. Given the uncertainty of measuring the development of systemic risks, however, the buffer rate is not set mechanically based on the indicators. Consequently, the Council's recommendations regarding the buffer rate will always be subject to an assessment of the individual indicators and other relevant information.
[1] Financial cycles have greater fluctuations and longer duration than economic cycles. The duration of a traditional economic cycle is approximately 8 years, while it is 15-20 years for a financial cy-cle, cf. BIS (2014).
| Illustration of the relationship between the Council's approach to assessing the buffer rate and a stylised financial cycle | Chart 1 |
|---|---|
 |
|
Early and gradual build-up of the buffer
The Council's approach to setting the buffer rate is based on early and gradual phasing-in. Several factors suggest that build-up of the buffer should start at an early stage of the financial cycle. Firstly, there is a risk that the build-up of systemic risks is not detected in time. One reason for this could be that risks are reflected in data with a certain lag. Secondly, according to legislation, an increase in the countercyclical buffer will enter into force 12 months after the Minister for Industry, Business and Financial Affairs has decided to change the buffer rate.[1]
If the build-up of the buffer starts at an early stage, the possibility of a gradual phase-in increases. This makes it easier for the institutions to adapt to the new, higher capital requirements[2] as they can meet the requirements by retaining profits, compared with a quick phase-in that could require them to raise equity in the markets.
In addition to the primary purpose of strengthening the institutions' resilience, the actual build-up of the buffer may dampen credit growth, thereby in itself reducing the build-up of systemic risks. In practice, the effect on credit growth may be expected to be limited, especially in periods of optimism when it will be relatively easy for the institutions to increase their capital. There is asymmetry in the buffer costs, as the costs of increasing the buffer early are relatively small compared with the costs, for society as well as the individual institution, of not having sufficient capital in crisis periods.[3]
[1] In extraordinary circumstances, the buffer rate may apply earlier, cf. legislation on the countercy-clical capital buffer (see Appendix D).
[2] See e.g. Bank of England (2016).
[3] See, inter alia, BCBS (2010a) and Kragh-Sørensen (2012).
2. Information basis for activating the buffer
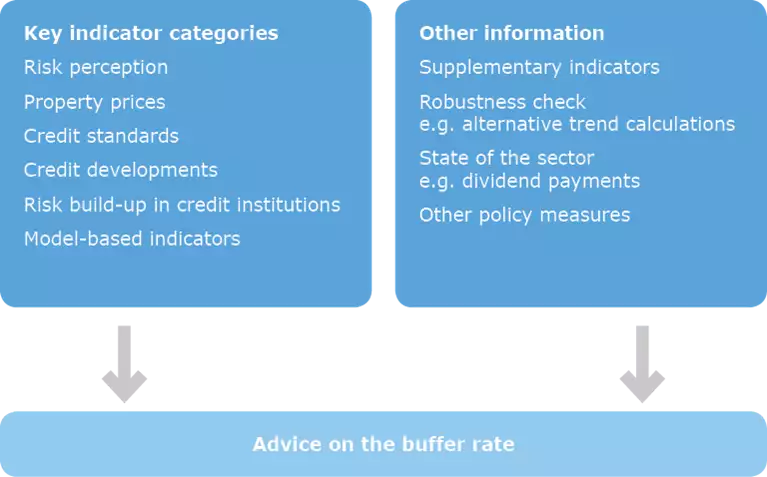
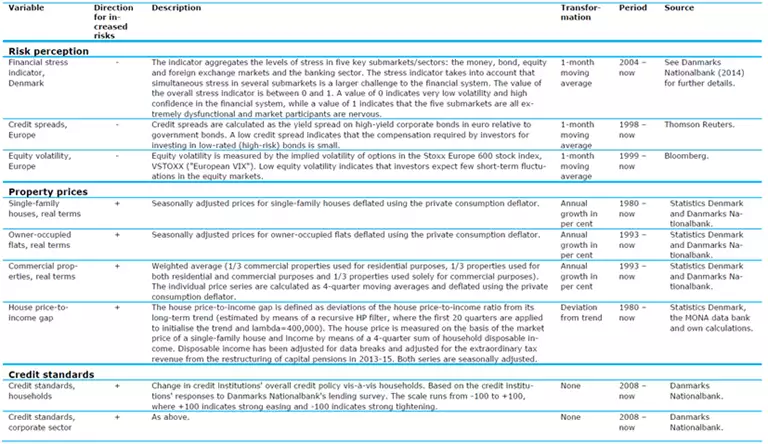
Decisions on setting and releasing the buffer are subject to uncertainty, because it is difficult to assess the cyclical position at a given time. The Council always faces the option of recommending to activate, build up or release the buffer or waiting until the next decision time, when new information will be available. The Council's assessment of the buffer rate is based a broad information basis, cf. Chart 2. The Council has selected a number of key indicators that are divided into six categories. In its assessment of the indicators, the Council takes both the level and recent developments into account. There are no perfect indicators, however, so the key indicators are supplemented by other quantitative and qualitative information. The following sections provide justifications for the key indicator categories, detailed in Appendix A. The content of the other information is also described in more detail below.
| Information basis for the Council's assessment of the buffer rate | Chart 2 |
|---|---|
 |
|
Categories and key indicators
The categories comprise several key indicators, cf. Appendix A. The key indicators are intended to capture situations of vulnerabilities building up in the financial system, which may cause the buffer to be activated. Some indicators signal the development in systemic risks at an early stage of the financial cycle, others at a later stage. The various indicators should contribute to shedding light on the cyclical position of the economy. Accordingly, there are also indicators for when risks materialise and the buffer should be released.[1]
The beginning of the financial cycle is often characterised by increasing risk appetite among investors.[2] This is reflected in higher asset prices, including prices of residential and commercial properties, and easier credit standards for households and firms. As the rise in property prices is expected to continue, this may cause households and firms to increase their debt, which may further push up asset prices. If such optimism continues and turns into general overoptimism (risk illusion), it may lead to excessive risk-taking and riskier balance sheets among credit institutions. The risk of a period of substantial losses and a sharp contraction of credit increases when borrower credit ratings are eased and credit growth is high.
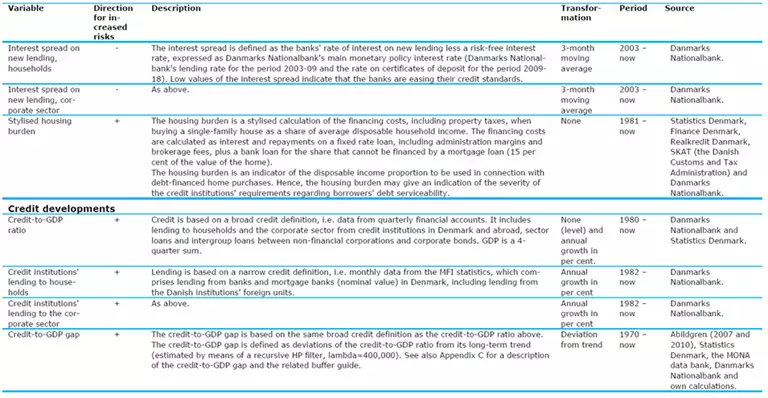
Key indicators in the "risk perception" category are intended to capture the sentiment in the financial markets. Systemic risks typically build up in periods of low volatility and risk premia in financial markets. Conversely, strong fluctuations and high risk premia may indicate that a systemic financial crisis is imminent. Accordingly, indicators in this category can also be used to assess whether the buffer is to be released. The "property prices" category contains indicators of developments in the residential and commercial property markets, while developments in the institutions' credit standards are captured by indicators in the "credit standards" category. The "credit developments" category includes indicators of actual credit developments, including the credit-to-GDP gap, which is comprised by international recommendations and legislation on the countercyclical capital buffer.[3]
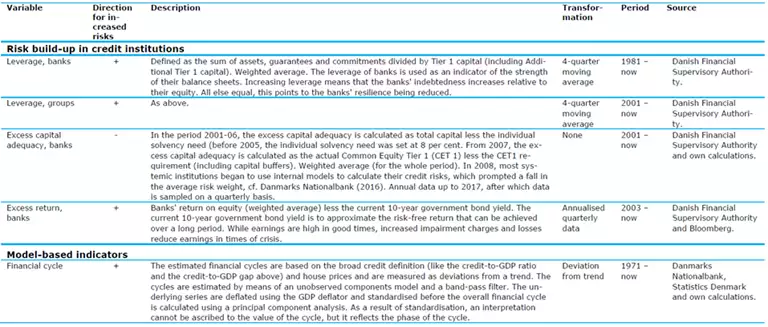
The "risk build-up in credit institutions" category includes indicators of the institutions' balance sheets, excess capital adequacy and earnings. In addition to providing information on the build-up of systemic risks, an earnings indicator can also be used to assess whether the buffer is to be released. Since earnings reflect losses and loan impairment charges, it may indicate whether a crisis has set in with consequences for the institutions. Earnings may also provide information about the need for maintaining the buffer. If earnings in the sector are robust, and there are no signs that the institutions will tighten their credit standards and reduce the credit supply to such an extent as to cause a credit crunch, this could call for postponing release of the buffer until the situation potentially deteriorates.
The "model-based indicators" category includes estimates of the financial cycle in Denmark. The Council takes into account various estimation methods, cf. Appendix A. The estimates indicate the cyclical position of financial developments. However, the estimates do not provide a clear picture of the current financial cycle due to estimation uncertainty at the end of the reference period. The estimates are consequently used as one of several factors in the overall assessment.
[1] If the identified risks slowly decline without a crisis having set in, this is expected to be reflected in the indicators that are also used to indicate risk build-up.
[2] See e.g. Aikman et al. (2017).
[3] The credit-to-GDP gap and the related buffer guide are described in more detail in Appendix C, while legislation, etc. is described in Appendix D.
Other information
When setting the buffer rate, other relevant information is also taken into account to provide a more detailed and qualified picture than indicated by the key indicators. Examples of various elements that are taken into account are described below.
Supplementary indicators
Developments in other indicators are used to put developments in the key indicators into perspective and to provide an overview of the overall risk outlook. For example, the credit-to-GDP gap is decomposed to examine whether developments are driven by credit or GDP. Moreover, various robustness checks are conducted, including different trend calculations and data projections.
To provide an overview of the overall risk outlook, the Council monitors a larger set of indicators that are discussed at each meeting of the Council.[1] For example, it monitors the institutions' customer funding gaps which indicate whether the need for market funding is changing.[2] Information from semi-annual accounts-based stress tests are also included in the Council's overall information basis. In addition, the Council monitors a market-based measure, SRISK, i.e. a market-based stress test.[3]
Information about the state of the sector is used to supplement the key indicators in the category "risk build-up in credit institutions" to get an overall picture of the institutions' robustness. This information includes loan impairment charges and dividend payments.
[1] See also the memo "Monitoring of systemic risks" on the Council's website.
[2] If market funding constitutes a large and increasing proportion of the institutions' total funding, this may amplify rising debt and asset prices, cf. e.g. Norges Bank (2013). In times of crisis, ac-cess to the capital markets may dry up. This may cause the institutions to reduce their balance sheets and tighten their credit standards.
[3] SRISK measures the market's assessment of a systemically important banking group's excess capital adequacy/shortfall in the event of a general equity market decline of minimum 40 per cent over the next six months. See Grinderslev and Kristiansen (2016) for a more detailed description.
Other policy measures
Other policy measures will also be taken into account when setting the buffer rate. The Council will assess whether measures other than the countercyclical capital buffer are better suited to addressing the risks identified. These may include both macroprudential and microprudential measures. Macroprudential measures aim to address systemic risks, i.e. risks where the entire system or parts of the system are expected to be affected if the risks materialise. Microprudential measures address risks of the individual institutions.
The Council will also take into account information about other measures that are being planned or already in use, including e.g. other macroprudential or microprudential requirements. They may also include future effects of fiscal or tax policies.
3. Information basis for releasing the buffer
Release of the buffer should prevent institutions from tightening credit standards and reducing lending to households and corporates to a greater extent than warranted by economic developments. The buffer may be released with immediate effect.
In the early stages of a financial crisis, asset prices will tend to decline, while financial market risk premia will increase. This may lead to losses and higher impairment charges for institutions. If these become excessive, capitalisation might be threatened. When institutions’ capitalisation is under pressure, and their capital headroom becomes uncomfortably low, they have to limit new lending until capital headroom reaches an acceptable level. Also, persistent financial market turmoil may limit institutions’ refinancing opportunities. This could cause institutions to tighten lending more than warranted by economic conditions, making it difficult for even creditworthy households and businesses to obtain loans. This, in turn, could reinforce an economic downturn and trigger a feedback loop.
Generally, decisions to release the buffer are based on the same information basis as decisions to activate and build up the buffer. The following sections describe indicators of special relevance when assessing whether the buffer should be released. However, it should be noted that there is no mechanical correlation between developments in single indicators and the Council’s assessment.
Institutions' lending capacity
The purpose of releasing the buffer is to give institutions more leeway to absorb potential losses while maintaining their lending.[1] Therefore, it may be relevant to release the buffer when institutions’ lending capacity is under pressure, i.e. their earnings are low, capital headroom is diminishing and they are experiencing loan losses.
Earnings and excess capital indicators may provide an indication of institutions’ lending capacity. When times are good, earnings tend to be high, while earnings are reduced by higher impairment charges and losses in times of crisis. During episodes of stress in the financial system when releasing the buffer might be under consideration, earnings may provide information whether the buffer should be released or maintained. If earnings in the sector are strong, and there are no indications that credit institutions will tighten credit standards and reduce the credit supply, this may justify postponing release of the buffer
[1] In this context, losses include both impairment charges and losses as well as potential increases in risk-weighted exposures due to growing credit risk on existing customers.
Lending indicators
It may be difficult to assess whether tightening of lending by institutions is excessive (undesirable supply side effect) or whether demand for credit among households and businesses is declining, which is to be expected during an economic downturn or recession. Therefore, indicators of credit growth, credit standards and credit quality (e.g. breakdown of impairment into impairment stages) are part of the assessment of whether to release the countercyclical capital buffer.
They buffer may be released partially or fully
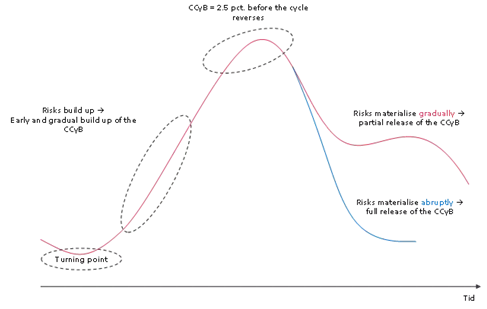
In connection with recommendations to release the buffer, the Council will consider to what extent and when the buffer should be released given the economic and financial situation. Depending on the situation, the buffer may be released partially or fully.[1] So, there are two different options for release of the buffer:
- Partial release of the buffer if risks materialise gradually.
- Full release of the buffer if risks materialise abruptly, resulting in large losses, i.e. there are indications that a systemic financial crisis is imminent or has already set in.
The two situations are illustrated by chart 3. Where the identified risks slowly decline without a crisis having set in, the buffer can be released gradually. In the second situation, the buffer will probably be released at once. The reason is that periods of financial stress may precede systemic crises, as evidenced in the most recent financial crisis.
[1] A recommended period during which the buffer rate is not expected to rise must be stated when the buffer rate is reduced.
| Illustration of situations, where the buffer may be released | Chart 3 |
|---|---|
 |
|
Partial release allows for an assessment of the need to release the buffer
Experience with release of the countercyclical capital buffer is still very limited.[1] Experience gained during the covid-19 pandemic shows that unforeseen economic shocks may occur, making it difficult to assess the extent and duration of a potential crisis. Therefore, it may be difficult to assess whether to release the buffer, and, if so, whether to release it partially or fully. This could justify a strategy of not releasing the buffer until there are specific indications that losses are materialising. However, with partial release of the buffer, it will be possible to regularly assess the need to release the buffer.
[1] Three historical episodes of buffer release: the UK in connection with Brexit, Hong Kong (?) and covid-19 (March 2020).
Communication
The Council's recommendation on the buffer rate is published after the Council's meetings. In the event of changes to the buffer rate, the Council will publish a recommendation addressed to the Minister for Industry, Business and Financial Affairs, who is responsible for setting the Danish buffer rate on a quarterly basis, cf. Appendix D. The Council will also publish its view on future changes to the buffer rate, e.g. whether the Council expects to recommend a higher buffer rate within the next year. The Minister for Industry, Business and Financial Affairs determines the final buffer rate.
A recommendation from the Council will contain:
- the recommended buffer rate
- justification for the recommendation
- time of implementation
- expectation of future changes
- the buffer guide (see Appendix C)
- appendix: set of charts with selected indicators.
The data underlying the key indicators and other relevant indicators, cf. Appen-dices A and B, will be published every quarter on the Council's website.
The Council may also publish recommendations addressed to the Minister for Industry, Business and Financial Affairs on recognition and setting of countercyclical capital buffer rates for Danish institutions' exposures in other countries, cf. Appendix D.[1]
[1] Recognition and any setting of buffer rates for Danish institutions' exposures in other countries are published on the website of the Ministry of Industry, Business and Financial Affairs.
Development of the methodology
The Council regularly monitors the approaches of other countries to setting the countercyclical capital buffer rate. The updated methodology is largely based on the experience gained from releasing and building up the buffer after the covid-19 pandemic in Denmark and abroad.
As more experience is gained, the Council will further develop its methodology for setting the buffer rate. The Council will also monitor future research of the quantitative effects of the buffer.
Literature
Abildgren (2007), Financial Liberalisation and Credit Dynamics in Denmark in the post-World War II Period, Danmarks Nationalbank, Working Paper, nr. 47.
Abildgren (2010), Business cycles, Monetary Transmission and Shocks to Financial Stability – empiricial evidence from a new set of Danish quarterly national accounts 1948-2010, Danmarks Nationalbank, Working Paper, nr. 71.
Adrian og Brunnermeier (2016), CoVaR, American Economic Review, vol. 106(7), s. 1705-1741.
Aikman, Kiley, Jung Lee, Palumbo og Warusawitharana (2017), Mapping heat in the U.S. financial system, Journal of Banking & Finance, vol. 81, s. 36-64.
Bank of England (2016), "The Financial Policy Committee's approach to setting the countercyclical capital buffer", Bank of England, A Policy Statement, april.
BCBS (2010a), An assessment of the long-term economic impact of stronger capital and liquidity requirements, august.
BCBS (2010b), Guidance for national authorities operating the countercyclical capital buffer, Basel Committee on Banking Supervision, december.
BIS (2014), Chapter IV: Debt and the Financial cycle, BIS Annual Report, nr. 84.
Cecchetti, Mohanty og Zampolli (2011), The real effects of debt, BIS, Working Paper, nr. 352.
Cecchetti og Kharroubi (2012), Reassessing the impact of finance on growth, BIS, Working Paper, nr. 381.
Danielsson, Valenzuela og Zer (2016), Learning from history: Volatility and Financial Crises, FEDS Working Paper, nr. 2016-093.
Danmarks Nationalbank (2011), Basel III og danske kreditinstitutter, Finansiel Stabilitet.
Danmarks Nationalbank (2014), Finansiel Stabilitet, 2. halvår.
Danmarks Nationalbank (2016), Finansiel Stabilitet, 1. halvår.
Detken, Weeken, Alessi, Bonfim, Boucinha et al. (2014), Operationalising the countercyclical capital buffer: indicator selection, threshold identification and calibration options, European Systemic Risk Board, Occasional Papers, nr. 5.
Drehmann, Borio, Gambacorta, Jimenez og Trucharte (2010), Countercyclical capital buffers: exploring options, BIS, Working Paper, nr. 317.
ESRB (2014), Recommendation of the European Systemic Risk Board of 18 June 2014 on guidance for setting countercyclical buffer rates (ESRB/2014/1).
Forslag til lov om ændring af lov om finansiel virksomhed og forskellige andre love, lovforslag L-133 2013-2014, fremsat 7. februar 2014.
Grinderslev, Kramp, Kronborg og Pedersen (2017), Financial Cycles: What are they and what do they look like in Denmark?, Danmarks Nationalbank, Working Paper, nr. 115.
Grinderslev og Kristiansen (2016), Systemic risk in Danish banks: Implementing SRISK in a Danish context, Danmarks Nationalbank, Working Paper, nr. 105.
Kragh-Sørensen (2012), Optimal capital adequacy ratios for Norwegian banks, Norges Bank Staff Memo.
Lo Duca, Koban, Bengtsson, Klaus, Kusmierczyk, Lang, Detken og Peltonen (2017), A new database for financial crises in European countries, ECB, Occasional Paper Series, nr. 194.
Lov om ændring af lov om finansiel virksomhed og forskellige andre love, lov nr. 268, 25. marts 2014.
Norges Bank (2013), Criteria for an appropriate countercyclical capital buffer, Norges Bank Papers, no.1.
Appendix A: Details on categories and key indicators
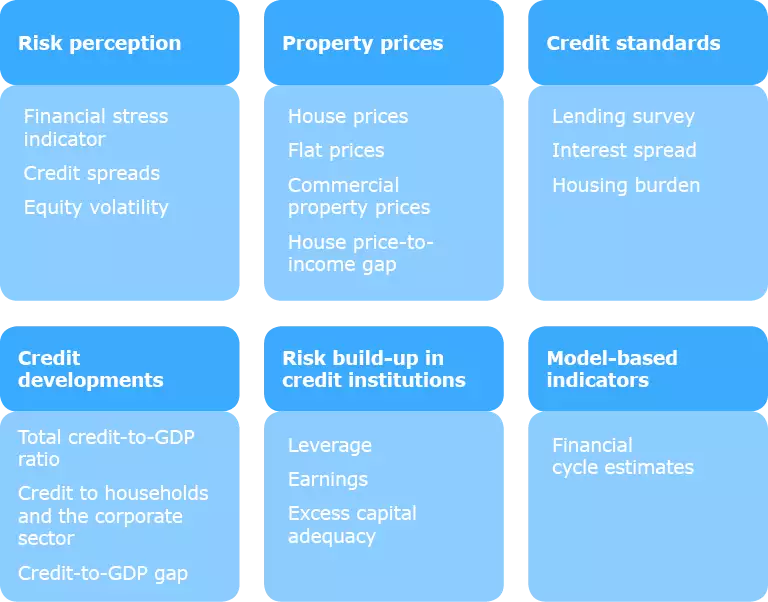
This Appendix describes in more detail the categories and selected key indica-tors that are to capture the development in systemic risks at various stages of the financial cycle. A total of 18 key indicators divided into various categories are considered, cf. Chart A.1.[1] Details on the key indicators are available in Table A.1.
[1] The indicators are evaluated on an ongoing basis, and any additions/updates are made if they are deemed to add value. The charts were updated in May 2018.
| Categories and related key indicators | Chart A.1 | |
|---|---|---|
 |
||
Risk perception
This category includes high-frequency market indicators, as market reversals are quickly reflected in the data. Systemic risks build up in periods when measured risks are low.[1] This happens if optimism during an expansion turns into general overoptimism (risk illusion) and/or in situations of generally increased risk appetite. This was, for instance, the case during the years leading up to the financial crisis which were characterised by a strong sense of optimism and willingness to make risky transactions. During that period, volatility and risk premia were low, as reflected in a very low level of the financial stress indicator, see chart A.2.
If, on the other hand, the level of the financial stress indicator is high, this may indicate that a systemic financial crisis is imminent, even though short periods of market turmoil are not necessarily early indications of a financial crisis.[2]
[1] A number of studies have found that systemic risks tend to build up during periods of low risk perception. See, for instance, Danielsson et al. (2016) and Adrian and Brunnermeier (2016). Aikman et al. (2017) find that risk perception is among the first factors to appear in the expansion phase of the financial cycle.
[2] Financial stress may also in itself contribute to the onset of a systemic financial crisis. For example, the financial sector relies on financing in order to grant loans. Financing is in part provided by the capital markets. In periods of financial stress and distrust among market participants, access to those markets can be difficult. This may put pressure on the institutions to reduce their balance sheets and lead to tighter credit standards.
| Risk perception: Key indicators | Chart A.2 |
|---|---|
| Financial stress indicator | Credit spread and equity volatility |
 |
 |
| Note: Grey markings indicate financial crises. See Table A.1 for source and a more detailed description of variables | |
Property prices
This category includes indicators of developments in prices in the housing market (houses and owner-occupied flats) and the market for commercial properties, cf. Chart A.3. The property market plays a crucial role, as a large share of lending by credit institutions is based on real property as collateral. When prices grow quickly a considerable price correction, which would cause credit institutions' credit quality to deteriorate significantly, becomes more likely. Furthermore, falling house prices may cause households to reduce their consumption. This may have an impact on the real economy and corporate activity, which may in turn lead to a higher risk of losses for the credit institutions.
Historically, in addition to being a reliable indicator of crisis, both in Denmark and internationally[1], price developments in the property market have also led credit developments.[2] This means that house prices are a leading indicator of credit developments, i.e. rising house prices signal the build-up of risks at an earlier stage of the financial cycle than credit developments.
[1] See e.g. Lo Duca et al. (2017).
[2] See e.g. Grinderslev et al. (2017).
| Property prices: Key indicators | Chart A.3 |
|---|---|
 |
|
| Note: Grey markings indicate financial crises. See Table A.1 for source and a more detailed description of variables | |
Credit standards
Build-up of systemic risks is often characterised by the credit institutions easing their credit standards. This reflects increased risk-taking among credit institutions. The reason could be that the institutions underestimate their risks (risk illusion) and/or increase their risk appetite. If they generally ease their credit standards, the institutions overall may become more vulnerable, although significant increases in aggregate lending are not observed.
This category also includes various indicators of the credit institutions' credit standards. In addition to the quantitative indicators in Chart A.4, the qualitative information from Danmarks Nationalbank's lending survey is also considered, cf. Table A.1.
| Credit standards: Key indicators | Chart A.4 |
|---|---|
| The banks' interest rate spread | Stylised housing burden |
 |
 |
| Note: Grey markings indicate financial crises. Right-hand chart: The stylised housing burden is stated as a percentage of disposable income. See Table A.1 for the source and a more detailed description of the variables. | |
Credit developments
Optimism, higher asset prices, generally increased risk appetite and easier credit conditions may lead to households and firms incurring more debt. Altogether, this contributes to strengthening total credit growth in the economy. If growth in total credit is higher than the economic development in general, this may reflect the build-up of financial imbalances.
This category includes various indicators of credit growth, cf. Chart A.5 (left), and the credit-to-GDP gap, cf. Chart A.5 (right). The credit-to-GDP gap is defined as deviations of the actual ratio of credit to GDP (credit-to-GDP ratio) from an estimated trend which is an approximation of the underlying structural factors, cf. Appendix C. The credit-to-GDP gap and the related buffer guide are comprised by international recommendations and legislation on the countercyclical capital buffer, cf. Charts C and D. In the most recent period, the credit-to- GDP gap has been very negative. The reason is that the estimated trend is buoyed up by the very high level of credit in the pre-crisis years, cf. Chart A.5 (right). Since the development in the credit-to-GDP gap may be caused by technical factors, the Council finds it important to include various credit development indicators.
The level of the credit-to-GDP ratio is high in Denmark, cf. Chart A.5 (right), and this is neither reflected in lending growth nor the credit-to-GDP gap. High debt may result in increased financial vulnerability, however.[1] Hence, the Council will take the high level of debt into account in its overall assessment of the buffer rate.
[1] Both directly and through real economic effects, see e.g. Cecchetti et al.(2011) and Cecchetti and Kharroubi (2012).
| Credit developments: Key indicators | Chart A.5 |
|---|---|
| Credit growth | Credit-to-GDP gap |
 |
 |
| Note: Grey markings indicate financial crises. See Table A.1 for source and a more detailed description of variables. | |
Risk build-up in credit institutions
Risk illusion and increased risk appetite among credit institutions may result in the institutions making risky transactions and their exposures increasing considerably compared to the institutions' equity capital. All else equal, this points to the institutions' resilience being reduced and the sector thus becoming more vulnerable. A vulnerable financial sector may lead to financial or economic shocks being amplified, e.g. by the credit supply being reduced more than warranted by economic trends. This may have potentially negative implications for the real economy.
The institutions' aggregate leverage, excess capital adequacy and earnings are used as key indicators of risk build-up in the credit institutions, cf. Chart A.6. Earnings may also provide information about whether a crisis has set in with consequences for the institutions, as increased impairment charges and losses reduce earnings in times of crisis.
| Risk build-up in credit institutions: Key indicators | Chart A.6 |
|---|---|
| Leverage and excess capital adequacy | Banks' return on equity |
 |
 |
| Note:Grey markings indicate financial crises. See Table A.1 for the source and a more detailed description of the variables. | |
Model-based indicators
This category includes estimates of the financial cycle in Denmark based on two different estimation methods, cf. Chart A.7 (left).[1] One estimate is based on a band-pass filter, BP-filter, where the minimum and maximum duration of the cycle are defined in advance and typically set at between 8 and 30 years. The second estimation method, the unobserved components model, UC, estimates the duration of the cycle based on data. The ability of the estimated financial cycles to be used as indicators in real time should be interpreted with caution as regards both the BP filter and the UC model.
An analysis of the financial cycle in Denmark shows that it is primarily driven by fluctuations in credit and house prices.[2] The average duration of house price and credit cycles is longer than that of the typical economic cycle. Moreover, house prices tend to lead credit, cf. Chart A.7 (right).
[1] The two methods are described in more detail in Grinderslev et al. (2017).
[2] Weighted based on a principal component analysis, see Table A.1. Other variables such as interest rates, stock indices, the balance of trade, the effective exchange rate, etc. are not included, since they do not contain long cycles and do not tend to display covariation with house prices and credit, see Grinderslev et al. (2017).
| Model-based indicators: Key indicators | Chart A.7 |
|---|---|
| Estimates of the financial cycle | Sub-components of the financial cycle |
 |
 |
| Note: Grey markings indicate financial crises. Left-hand chart: BP indicates that the cycle has been estimated using a band-pass filter. UC indicates that the cycle has been estimated using an unobserved components model. Right-hand chart: House price cycle and credit cycle where the trend has been estimated using a BP filter. See Table A.1 for the source and a more detailed description of the variables. | |
Table A.1 Key indicators
Appendix B: Other relevant indicators
In addition to the key indicators and the buffer guide (see Appendix C), the Council will publish selected other indicators on its website.
The Council's key indicators represent most of the categories from the ESRB's recommendation, cf. Appendix D. In addition to the key indicators, the Council will also publish a decomposition of the credit-to-GDP gap and the house price-to-income gap, cf. Chart B.1 and B.2, respectively. In addition to the pure price development in the property market, the Council will also consider several of the indicators that are included in the heat map published for the housing market.[1]
The ESRB also recommends publication of an indicator for the "measures of ex-ternal imbalances" category. For some countries, current account deficits are considered to be good indicators of systemic financial crises.[2] Denmark has a large current account surplus. The indicator is not included as one of the Council's key indicators, as it is not deemed to be a relevant basis on which to activate the buffer. However, external imbalances will be considered to be aggravating circumstances, so the category is monitored as part of the general monitoring of risk. In order to comply with the ESRB's recommendation, the Council will publish the balance of payments in per cent of GDP, cf. Chart B.3, as an indicator of this category.[3]
As a general rule, Charts B.1-B.3 (with related data) will be published every quarter. In addition, the Council may choose to publish other relevant indicators that may vary from time to time and which are included in the justification for the selected buffer rate.
[1] A heat map of the build-up of systemic risks in the housing market is available here: http://www.risikoraad.dk/media/1224/dsrr21-heat-map-for-the-build-up-of-systemic-risks-on-the-housing-market-2018.pdf
[2] Cf., inter alia, Detken et al. (2014).
[3] Ultimately, the Minister for Industry, Business and Financial Affairs must comply with the recommendation as the designated authority.
| Broad and narrow definition of credit and GDP | Chart B.1 |
|---|---|
 |
|
| Note: As regards the broad and the narrow definition: See Appendix C. The series have been adjusted for data breaks back in time. Source: Abildgren (2010), Danmarks Statistik, MONA's databank og Danmarks Nationalbank. |
|
| House prices and disposable incomes | Chart B.2 |
|---|---|
 |
|
| Note: Nominal house price is the market price of a single family house according to Statistics Denmark, and household disposable income is from Danmarks Nationalbank's MONA data bank. Both series have been seasonally adjusted. Disposable income has been adjusted for data breaks back in time and stripped of extraordinary tax revenue from the restructuring of capital pensions in 2013-15. Increase in real house prices for single-family houses is from the MONA data bank. Source: Statistics Denmark, the MONA data bank, SKAT and own calculations. |
|
| Balance of payments-to-GDP ratio | Chart B.3 |
|---|---|
 |
|
| Note: The balance of payments-to-GDP ratio is shown as a 4-quarter moving average. Source: Statistics Denmark. |
|
Appendix C: Definition of the credit-to-GDP gap
The credit-to-GDP gap is an indicator of excessive credit levels where growth in total lending increases faster than the general economic growth and underlying structural factors. The structural factors cannot be observed directly and develop over time. In practice, the structural level is approximated by a trend. Deviation of the actual ratio of credit to GDP (credit-to-GDP ratio) from its trend is called the credit-to-GDP gap. Historically, the indicator has been good at predicting systemic bank crises across a number of countries.[1] Accordingly, the credit-to-GDP gap, including the relevant buffer guide, plays a key role in international recommendations and legislation on the countercyclical capital buffer, cf. Box C.1 and Appendix D.
The trend used to calculate the credit-to-GDP gap is estimated by means of a recursive Hodrick-Prescott filter, HP filter, with a high smoothing parameter (λ=400,000). This is in line with international guidelines, cf. ESRB (2014) and BCBS (2010b). The first 20 quarters are applied to initialise the trend, which is then calculated recursively by adding one quarter at a time. This means that the trend is always estimated based on the information that is available at the time in question.
Since the estimated trend is affected by the high lending activity in the pre-crisis years, among other factors, various robustness checks are conducted of the buffer guide as input for setting the buffer rate. Furthermore, the credit-to-GDP gap is supplemented with other key credit development indicators that are not based on a statistical trend.
In addition to trend calculation guides, the Basel Committee has set out credit definition guides, which are also included in the standard method for calculating the buffer guide in the ESRB's recommendation, cf. Box C.1.[2] The guides as well as the standard method apply a broad definition of credit. The broad definition for the Danish data is based on Danmarks Nationalbank's financial accounts statistics and comprises loans to domestic households and non-financial corporations from both Denmark and abroad as well as securities issued (excluding equities). Using the broad definition reduces the probability of overlooking credit growth in other parts of the financial system, which may potentially happen when using a narrower definition.
The challenge of the broad definition is that financial accounts are published a relatively long time after the end of a quarter. Therefore, the credit-to-GDP gap is supplemented by another credit measure based on a narrower definition of credit. The narrower definition is based on the balance sheet statistics for banks and mortgage banks (also called the MFI[3] statistics), which are published on a monthly basis, and include lending to domestic households and non-financial corporations by banks and mortgage banks in Denmark.[4]
[1] See e.g. Drehmann et al. (2010) and Detken et al. (2014).
[2] Cf. BCBS (2010b) and ESRB (2014). In ESRB (2014) it is possible to measure and calculate the credit-to-GDP gap using an alternative method if this reflects national conditions better than the standard method. However, the alternative credit-to-GDP gap must be calculated and published in addition to the standardised credit-to-GDP gap.
[3] MFI: Monetary Financial Institutions.
[4] Also includes lending to residents by the Danish institutions' foreign units.
| Buffer guide | Box C.1 |
|---|---|
|
The buffer guide is a mechanical calculation based on the credit-to-GDP gap and is an internationally consistent point of reference, cf. ESRB (2014) and BCBS (2010b). When the buffer guide is greater than zero, the relevant authorities must consider whether to activate the countercyclical capital buffer. As the buffer guide is based on a single indicator, it cannot stand alone. Therefore, other quantitative and qualitative information must be included in the decision-making basis with a view to setting the final (applicable) buffer rate. The ESRB recommends that the buffer guide should be published together with other relevant indicators and a justification of the final buffer rate. The buffer guide is calculated using two thresholds: a lower threshold of 2 percentage points and an upper threshold of 10 percentage points. The buffer guide is set at zero when the credit-to-GDP gap is lower than 2 percentage points. When the credit-to-GDP gap exceeds 10 percentage points, the buffer guide is set at 2.5 per cent of the total risk exposure amount. Hence, there is a cap on the buffer guide, although the final guide may be set at a higher value if warranted by the assessment basis. The buffer guide is calculated linearly between the two thresholds.1 The chart shows the correlation between the credit-to-GDP gap and the buffer guide based on the Danish data. |
|
| Credit-to-GDP gap and buffer guide | |
 |
|
| Note: The credit-to-GDP gap is defined as deviations of the credit-to-GDP ratio from its long-termed trend, cf. Table A.1. Source: Abildgren (2007), Abildgren (2010), Statistics Denmark, The MONA data bank, Danmarks Nationalbank, and own calculations. |
|
| 1: The specific formula is given by: (2.5 * (credit-to-GDP gap – 2))/8, where 8 is the difference between the upper and lower threshold (10-2). | |
Appendix D: Background
The countercyclical capital buffer was introduced by the Basel Committee on Banking Supervision, BCBS, in December 2010 in connection with the Basel III rules.[1] The stricter Basel III requirements were implemented in EU legislation via the Capital Requirements Directive and the related Regulation (CRD IV/CRR). The countercyclical capital buffer is thus a macroprudential instrument in all EU member states. The Capital Requirements Directive was incorporated into Danish law via a revision of the Financial Business Act implemented in March 2014.
The framework of the countercyclical capital buffer applying to credit exposures in Denmark will be phased in gradually over a number of years. The buffer rate can be set at up to 1.5 per cent in 2017, 2 per cent in 2018 and 2.5 per cent in 2019. After that time, it can be set at a higher value if justified by the assessment basis. The buffer rate is measured in increments of 0.25 percentage point. Except in extraordinary circumstances, the applicable buffer rate will be announced at least 12 months before it takes effect for the institutions.[2]
The requirement that the institutions must maintain a countercyclical capital buffer is a "soft" requirement. This means that the institutions will not lose their licences if they do not meet the total buffer requirement, but they will be required to submit a capital conservation plan to the Danish Financial Supervisory Authority, and e.g. bonus and dividend payments will also be limited.[3]
The countercyclical capital buffer is an addition to the structural minimum requirement. The minimum requirement applies in both good times and bad and aims to ensure that the institutions are basically sufficiently well-capitalised. The countercyclical capital buffer will be built up and released in step with the development in financial systemic risks and thus varies over time.
In Denmark, the Minister for Industry, Business and Financial Affairs is the designated authority for the countercyclical buffer, i.e. the Minister decides whether the buffer is to be activated, built up or released. This means that the Minister is responsible for setting the buffer rate for domestic credit exposures and for evaluating its level every quarter. According to the explanatory notes to the Danish Financial Business Act, the Minister should take the following into account when setting the buffer rate:
- the buffer guide
- the ESRB’s recommendation on setting a countercyclical buffer rate, cf. below
- other variables deemed relevant in order to address cyclical systemic risks.
In connection with the quarterly setting of the buffer rate, the Minister for Industry, Business and Financial Affairs must publish an announcement on the website of the Ministry of Industry, Business and Financial Affairs, cf. the Danish Financial Business Act. This also applies when the buffer rate is unchanged from the previous quarter. As a minimum, the announcement must provide information about:
- the current buffer rate, including justification thereof
- a measure of the credit-to-GDP ratio and the credit-to-GDP gap
- the buffer guide
- the date when the institutions must fulfil the buffer when the buffer rate is raised
- when the buffer rate is reduced, a recommended period during which the buffer rate is not expected to rise. The buffer rate can be fully or gradually reduced, depending on the circumstances.
In June 2014, the ESRB published a recommendation, ESRB (2014), providing guidance for setting countercyclical capital buffer rates. The ESRB recommends, inter alia, that, in addition to the credit-to-GDP gap, the designated authorities should monitor a set of alternative variables that also indicate the build-up of cyclical systemic risks. Such variables include:
- measures of potential overvaluation of property prices
- measures of credit developments
- measures of external imbalances
- measures of the strength of the institutions' balance sheets
- measures of private sector debt burden
- measures of potential mispricing of risk
- measures derived from models that combine the credit-to-GDP gap and a selection of the above measures (multivariate models).
The ESRB recommends that the designated authorities should publish at least one variable from each measure, except the latter, at the same time as the quarterly announcement of the countercyclical buffer rate. It is assumed that the data is available and that the variables are deemed to be relevant.
In addition, the ESRB recommends that the designated authorities should monitor a set of alternative variables providing information about whether the buffer should be maintained, reduced or released completely. Such variables include:
- measures of stress in the financial markets, e.g. the spread between money market interest rates or bank CDS premia
- measures of general systemic stress, e.g. a composite indicator such as the ECB's Composite Indicator of Systemic Stress, CISS.
If these variables are available and relevant in the countries concerned, the ESRB recommends that at least one variable from each measure should be published at the same time as the quarterly announcement. In order to be able to decide whether the buffer should be maintained, reduced or released completely, the ESRB recommends that the designated authorities should exercise greater judgement when monitoring the variables.
[1] Read more about Basel III in e.g. Danmarks Nationalbank (2011).
[2] The institutions must meet the countercyclical capital buffer requirement with Common Equity Tier 1 capital.
[3] In addition to the countercyclical capital buffer, the total buffer requirement consists of the capital conservation buffer and the systemic buffer.
Buffer rates in other countries
Other countries' buffer rates have influence on Danish institutions with international exposures. In Denmark, banks, mortgage banks and the so-called investment firms I (hereinafter referred to as the institutions) will be required to maintain a countercyclical capital buffer. The institution-specific buffer rate will be calculated as the weighted average of the countercyclical buffer rates applying to the countries in which the institution has exposures. For example, if an institution has 90 per cent of its risk exposure in country A, which has set a buffer rate of 1 per cent, and 10 per cent of its risk exposure in country B, where the buffer rate is 2.0 per cent, the institution will be required to maintain an institution-specific countercyclical capital buffer of (0.9*1+0.1*2) per cent = 1.1 per cent of its total risk exposure.
In Denmark, the Minister for Industry, Business and Financial Affairs is responsible for assessing and recognising buffer rates in other countries. Under EU legislation, there is mandatory reciprocity of buffer rates for credit exposures up to 2.5 per cent, and voluntary reciprocity of higher buffer rates. Furthermore, the Minister for Industry, Business and Financial Affairs can decide to set a countercyclical capital buffer for Danish institutions' exposures towards non-EU countries. This could be relevant if the institutions have significant exposures towards such countries. Recognition and any setting of countercyclical capital buffers in other countries are published on the website of the Ministry of Industry, Business and Financial Affairs. The Danish Financial Supervisory Authority is responsible for supervising whether the individual institutions meet the institution-specific requirements.